Sensitivity Analysis
We've converted our spreadsheet model to a risk analysis model, run a Monte Carlo simulation with Risk Solver, and examined the full range of outcomes for Net Profit through statistics and percentiles, charts and graphs. Now we can begin to take steps towards risk management: Using the model to determine how we can reduce the chance of a loss -- and increase the chance of a (larger) profit.
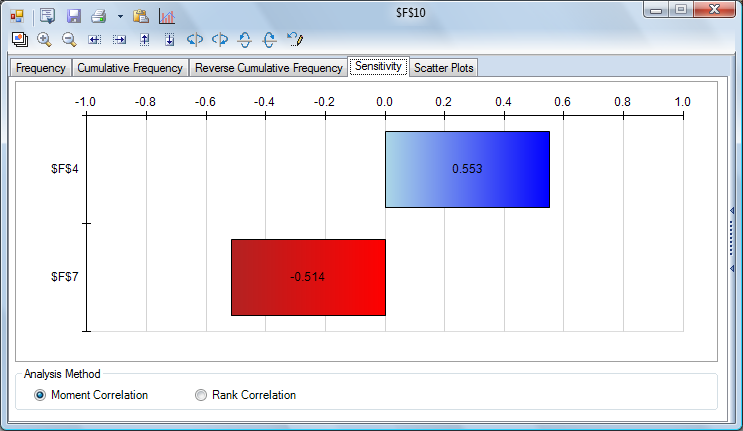
The Sensitivity tab in the Uncertain Function displays a Tornado chart that shows you how much Net Profit (cell F10) changes with a change in the uncertain variables -- our integer uniform distribution at cell F4, and the triangular distribution for Unit Cost at cell F7. In this model there are only two uncertain variables, but in a large model with many such variables, it’s usually not obvious which ones have the greatest impact on outcomes such as Net Profit. A Tornado chart highlights the key variables, as shown below:
Our Unit Cost at cell F7 is negatively correlated with Net Profit, as expected: Higher Unit Costs leads to lower Net Profits. Notice that our integer uniform distribution at cell F4 is positively correlated with Net Profit: What does this mean?
Since we used =CHOOSE(F4,B4,B5,B6) for Sales Volume, on each trial where F4 is 1 we use 100,000 units sold; when F4 is 2 we use 75,000 units sold; and when F4 is 3 we use 50,000 units sold. The fact the F4 is positively correlated with Net Profit is telling us that we make higher profits when the market is slow, not when it's hot. Our typical Selling Price is lower when the market is hot, and the increased Sales Volume doesn't make up for this.
The state of the market is outside of our company and our direct control. But our production costs, while variable and uncertain, are more subject to our control. Having seen that our Net Profit suffers in a hot market because of the narrow margin we have between our typical Selling Price and our Unit Cost, we're motivated to try to improve this situation.We want to ask "what if our (uncertain) Unit Costs could be reduced?" -- in the presence of our uncertain Sales Volume and Selling Price. Risk Solver empowers us to ask and answer exactly this question, as shown on the next page.
< Back to: Monte Carlo Simulation Tutorial StartNext: Interactive Simulation with Charts and Graphs >

