As stated in the introduction, Windows Azure Marketplace is a cloud-based data bazaar where developers can download large data sets across several categories for use in their own custom applications. The data sets can be imported to Excel using Microsoft Power Query.
To get started, click here and either register for a new Windows ID, or login using your existing ID. After you are logged in, go to the Real GDP Per Capita By State data set (https://datamarket.azure.com/dataset/bea/realgdppercapitabystate) and subscribe to this data set (the service is free).

If you do not have Microsoft Power Query installed, you can install it now by visiting the link below and following the installation instructions.
http://office.microsoft.com/en-us/excel/download-microsoft-power-query-f...
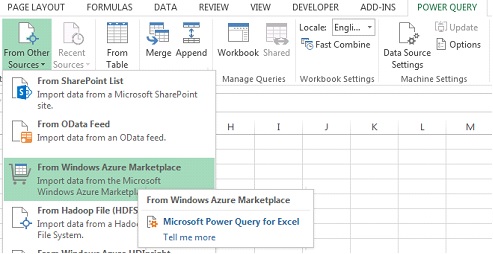
From here, start Microsoft Excel with a blank worksheet, and on the Excel ribbon, click the Power Query tab, then select From Other Sources, and select From Windows Azure Marketplace.
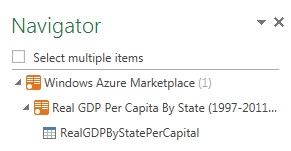
The Power Query Navigator Task Pane opens on the right of your screen, and your Windows Azure Marketplace subscriptions will be listed. Expand Real GDP Per Capita By State by clicking the arrow to the left of the entry, then selecting RealGDPByStatePerCapital.
The Query Editor opens and displays the data set.
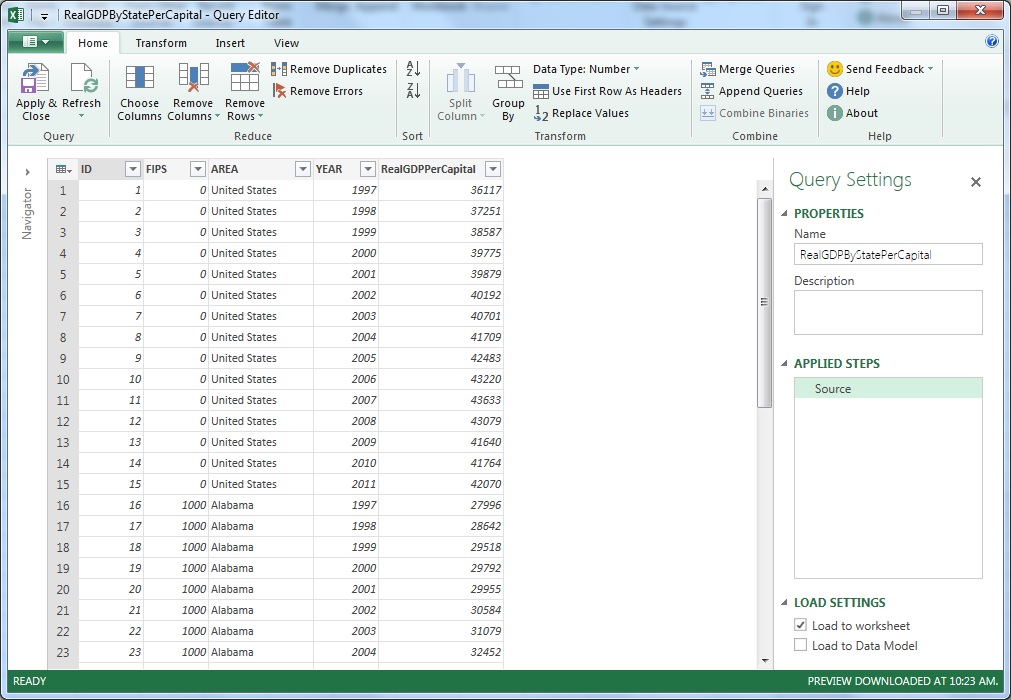
For the purposes of this example, we will focus on the national GDP. Click the down arrow at Sort Ascending and uncheck (Select All) to clear all entries.
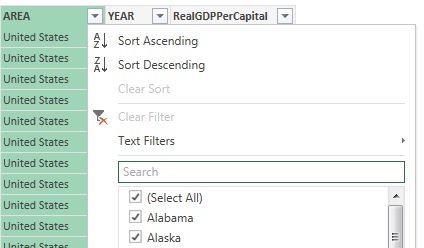
Scroll down and select United States.
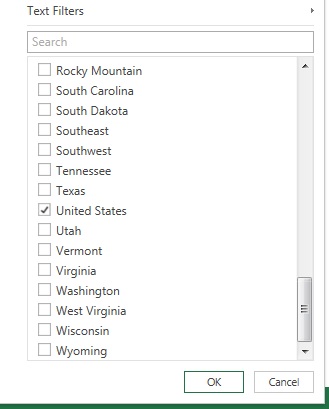
Click OK.
Click the Apply & Close tab to save the settings.

A new worksheet opens displaying the national GDP from 1997-2011.
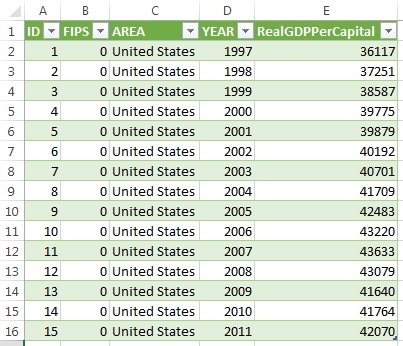
Once a data set has been downloaded to Excel, any of Analytic Solver Data Science's classification or prediction algorithms, clustering techniques, and partitioning options can be used. From here, you could utilize an ARIMA model fitting feature to forecast future U.S. GDP, or use the Chart Wizard to create a line graph to find trends in the data.
